
Sprint Planning
How to minimize the risks involved in planning and improve the delivery process?
25 de junho de 2021

“Will my team commit to delivering all these items?“
This is a relatively common question in sprint planning meetings. This question is often answered with a “I think so” or “let’s track it and see what happens”.
Well! During the sprint we can confirm whether a certain number of items is adequate or not for each team.
But how can we improve this process?
Is there a simple and practical way to know the risk involved when we take on commitments?
In this post we will present a very easy and quick method to improve your sprint planning.
You will have a systematic view of the commitments made by the team, and will be able to quantitatively measure the risks that teams are likely to face.
Interested? Then let’s go…
The first thing you will need is the history of items delivered by your team in recent sprints.
The more data you have at this point, the more structured your planning and results will be.
To start, we must build a list as shown in the image below.
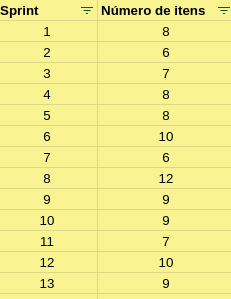
Now we can sort the data in descending order of the “number of items” column.
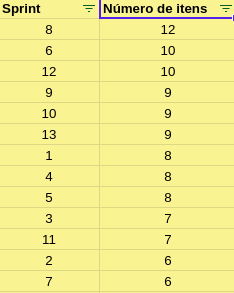
So far, nothing out of this world, right?
Well then.
Now create an index for each row, where the first will be row 1, the second row 2, and so on.
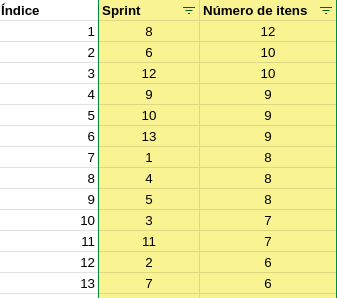
Pay attention now. Take the total number of rows (in our example there are 13 sprints) and calculate 10% of this value, and consecutively 25%, 50%, 75% and 90%.
If the number was a fraction, calculate the next whole number.
Now, use the resulting numbers as indices to look up in your data table.
For example, if when calculating 50% your value was 7, then you should look at the row with index 7.
Done. That’s it. You’ve just discovered that committing to 8 items has the same risk as flipping a coin, that is, 50%. Are you, your team, and the client comfortable with this risk?
If you’d like a bit more certainty about what might happen in sprint planning, you might want to take on a lower risk, say 25%.
So, let’s take the index resulting from the 75% calculation, which in this case is 10, and then we’ll find that committing to 7 items has a 25% risk.
In other words, a much lower risk, with just 1 fewer item.
OK! But there’s a question:
“Why don’t we calculate the situation with 0% risk?“
Simple, because it will never exist.
Every time a team commits to a delivery, they are assuming that “in the future” they will have delivered X items, for example. But we can never be sure about the future.
That is, we don’t have the ability to know, with zero margin of error, all the events that can influence a team’s delivery.
From a client communication standpoint, we will also be much more informed, because we are not just communicating that “we believe it’s possible”, but we are saying that “based on the team’s delivery history, the risk involved in committing to X items is 25%”.
Thus, we achieve much clearer, more transparent, and data-driven communication.
Making this calculation is very simple!
It helps the team take on commitments with much more security, helps us communicate the risks to the client, and helps us determine the delivery speed of each team.
The calculation can be done using other measurements, for example, the number of Story Points delivered in each sprint.
The calculation method is the same and the interpretation of the results is also the same.
It is important to highlight that having this view at the time of taking on the commitment does not replace the daily monitoring, through ceremonies, of each delivery and taking corrective actions if the team deviates from the plan.
But that’s a topic for a future post.
This post was developed by Zappter Luciano Osório, Squad Leader at Zappts.
💙 Want to learn more? Check out our post Scrum: understand once and for all what it is, how it dramatically increases your results and why use it.
Share this article
Related articles

16 set 2026
The End of Passive SaaS: Why You’ll Pay for Outcomes, Not Seats
The traditional software pricing model based on per-user licenses (seat-based SaaS) faces an inevitable decline in 2026.

09 set 2026
The Timid Autonomy Dilemma: Why Keeping AI in a Suggestion-Only Role Is Killing Your Margins
This article analyzes the financial impact of this "timid autonomy" and advocates for an urgent shift to the "Human-on-the-loop" (HOTL) model.

02 set 2026
The "SaaSocalypse" is actually an architecture and identity crisis.
This article reverse-engineers a real-world success story (anonymized) from the financial sector, dissecting the layers of...